Logistics planning · Military · Emergency management · Ground rescue
Know what is there.
Plan what can actually be done.
Continuity is a logistics planning platform for operations where the infrastructure is damaged and the data is incomplete. It fuses frontline evidence, infrastructure state and power need into one model, then plans supply, movement and restoration with the crews, equipment, corridors and fuel on hand.
Every value states its source. Missing data is never rounded up.
- Evidence radius
- 10 km
- Substations
- ≥ 35 kV
- Contingency
- N-1
- Provenance states
- 8
From the product source. Full table below.
01 — Capabilities
Evaluate the ground. Size the need. Plan the work.
Frontline data
Mapped substations, lines, hospitals, water works. Satellite, thermal, weather and connectivity feeds, each reporting fresh, cached, stale or not configured.
Power need
Critical loads as kW sinks in a typed dependency graph. Capacities start unknown; planning defaults are applied and labelled assumed.
Restoration plan
Crews, equipment, corridors and hourly power flow solved together. Plans compared on time to essential service, cost and N-1 resilience.
02 — Operating picture
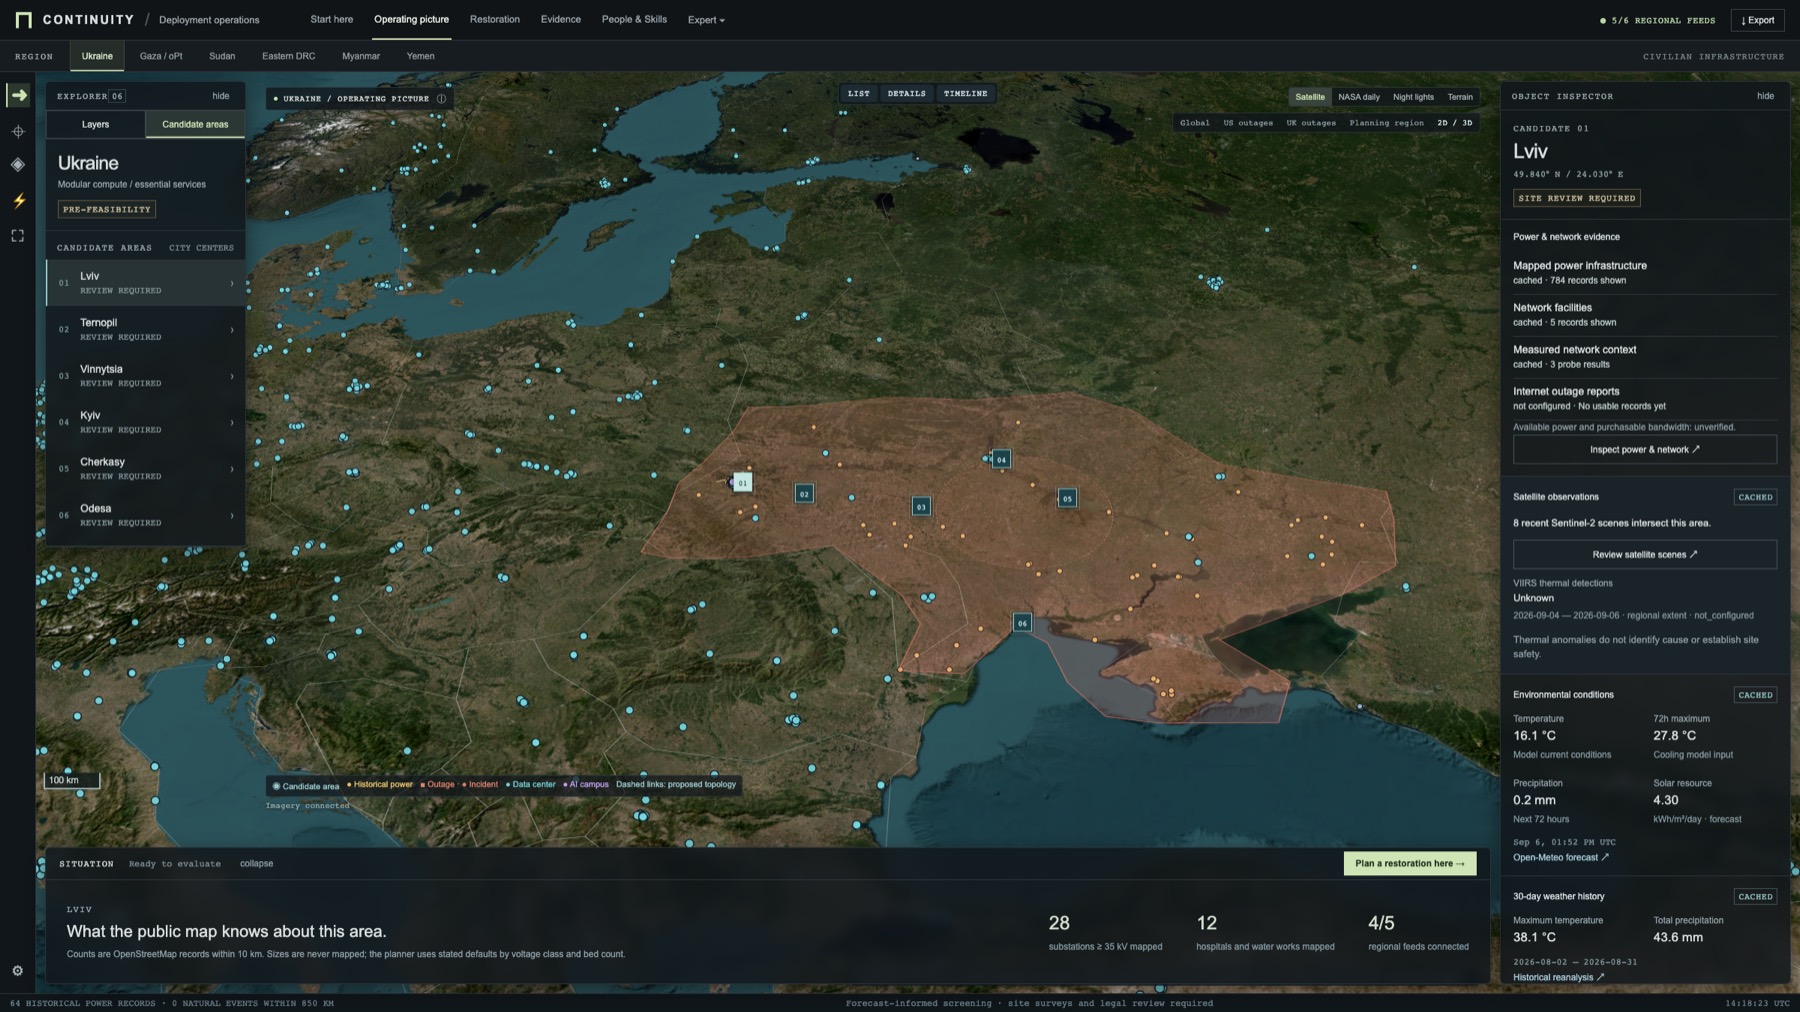
One picture. Every feed labelled.
Feeds, candidate areas, an inspector naming each source and its state. The hero shows the same picture tilted in 3D.
Operating picture · 2DUkraine · Lviv
03 — Dependency model
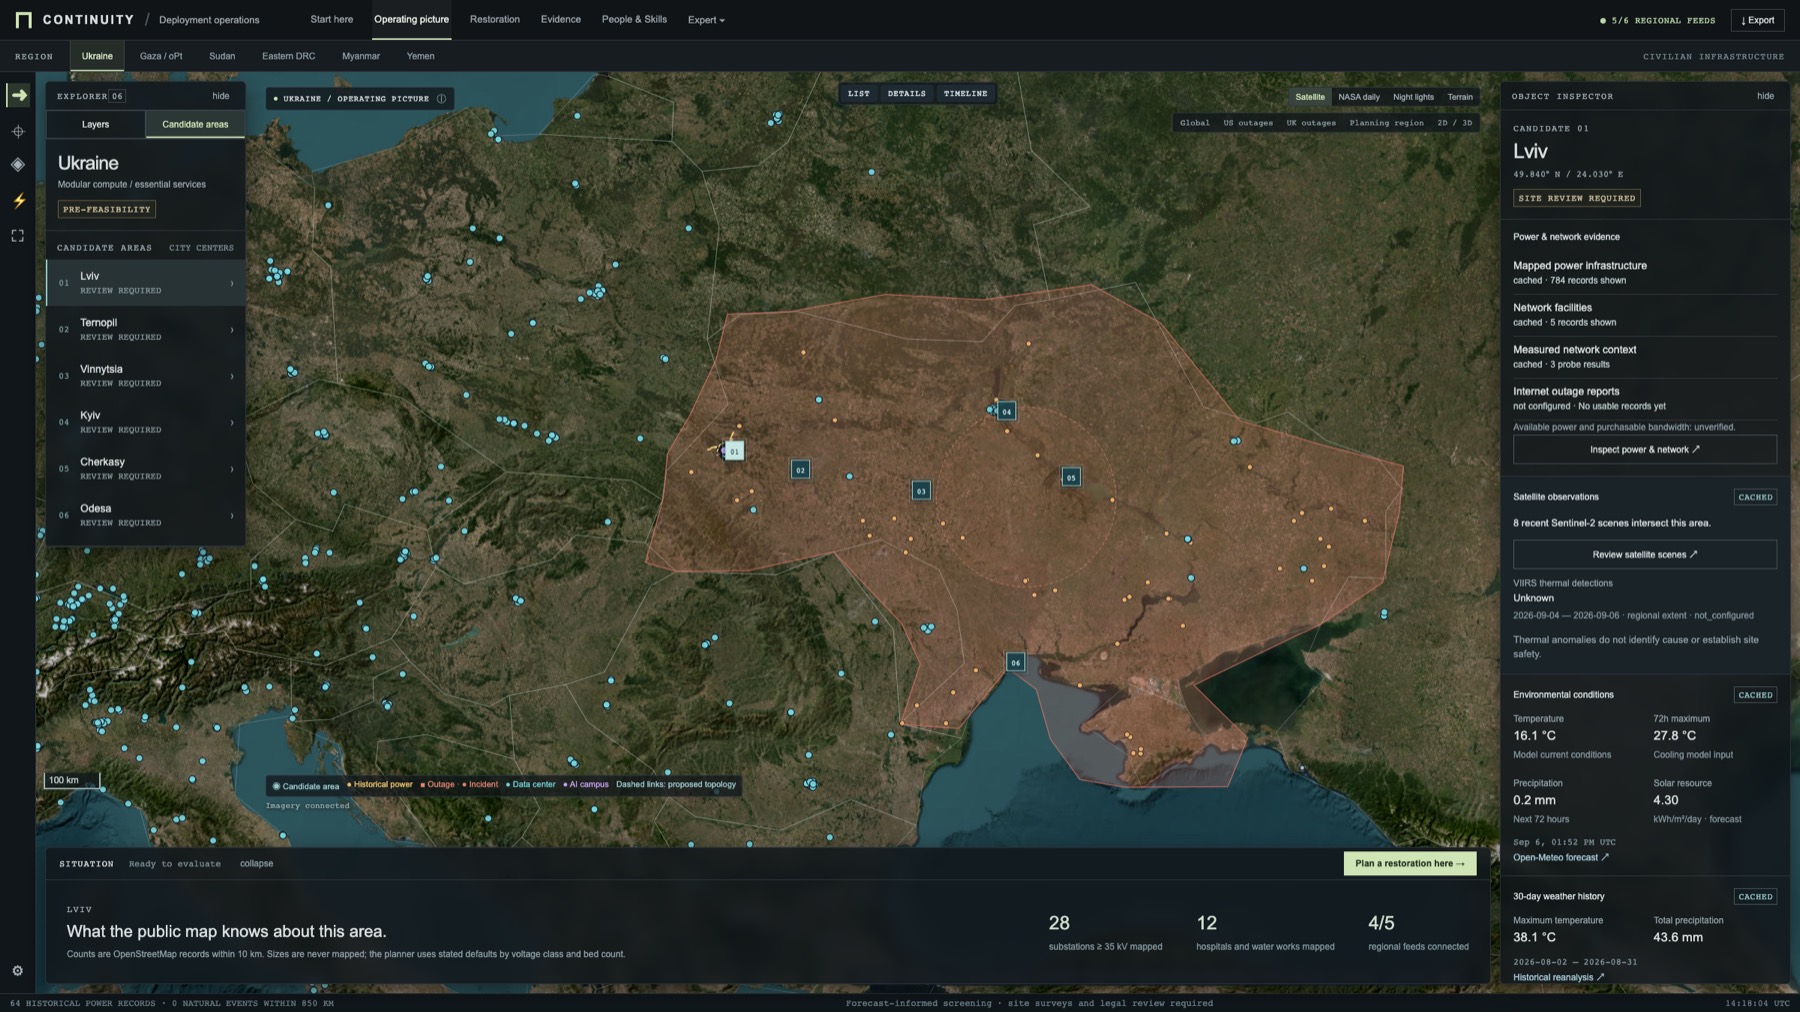
Typed nodes. Typed edges. Bottlenecks named.
Generator → line → substation → feeder → critical load. Identity and position observed. Topology inferred, rule stated. Capacities unknown until entered.
Dependency model · 3DPractice example · invented
04 — Restoration planner
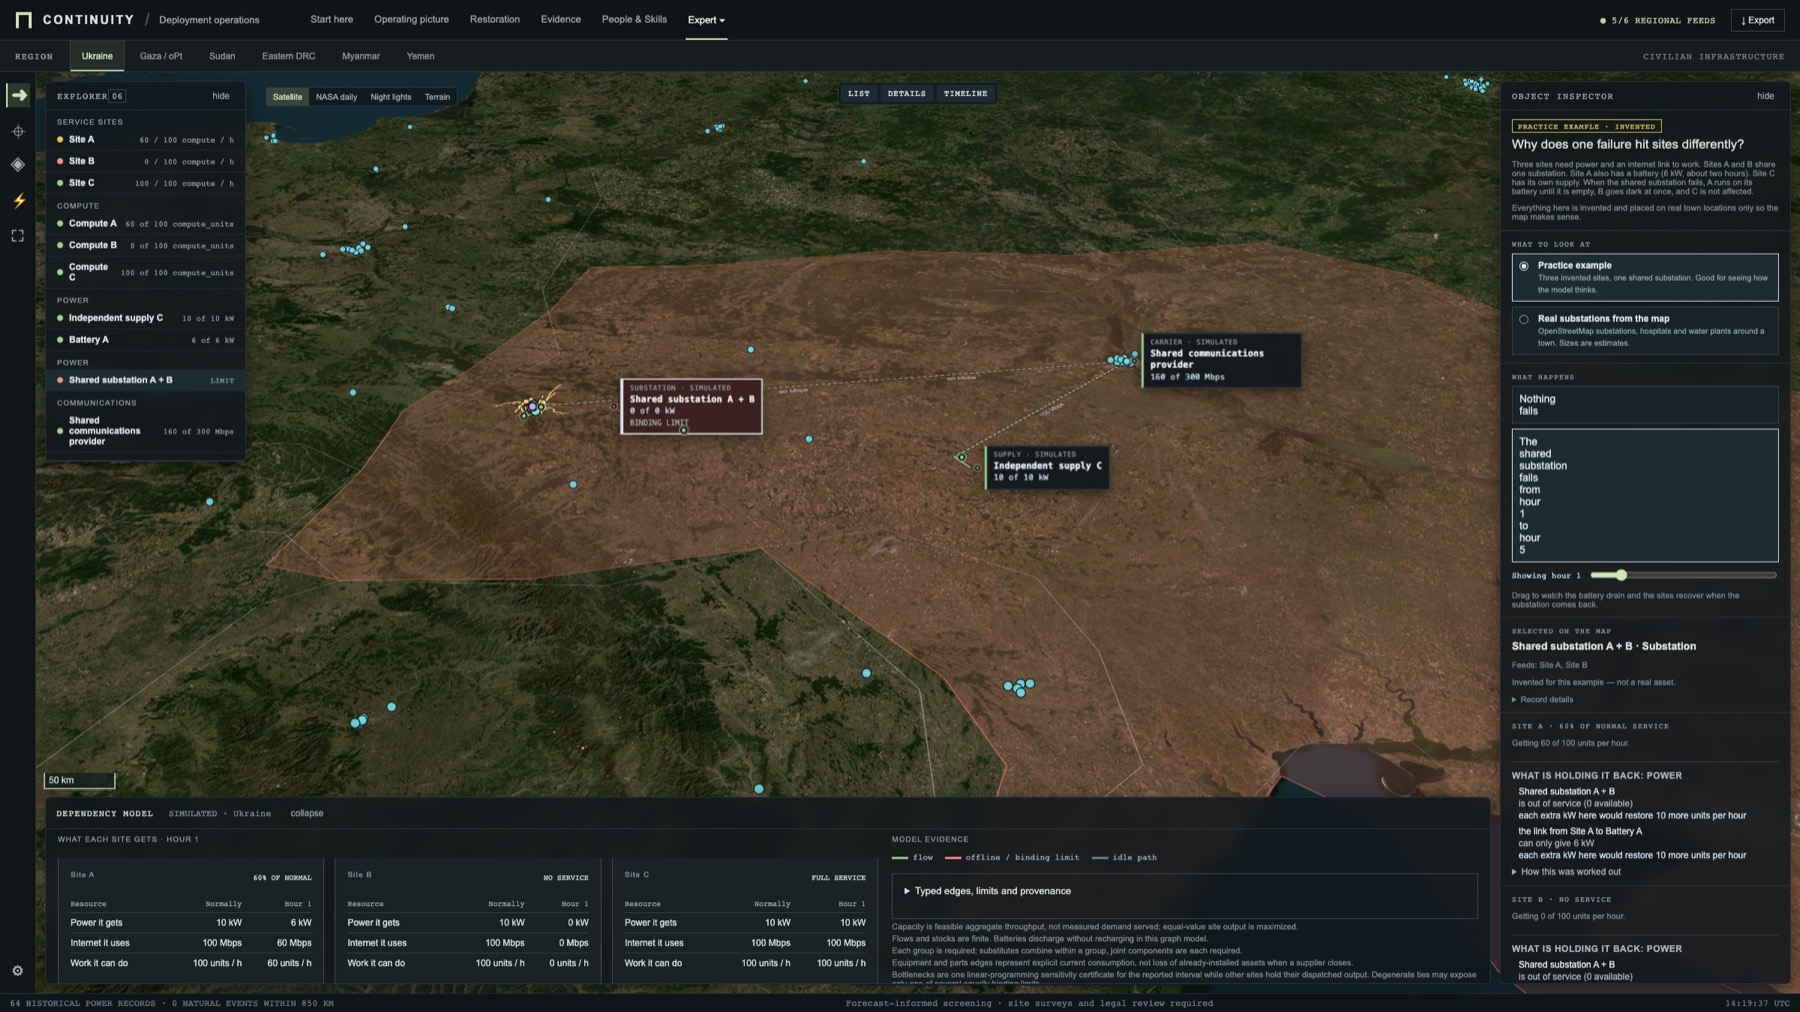
One incident. Three plans. Each names its weakness.
One mixed-integer programme assigns crews and equipment, chooses corridors and dispatches power hour by hour, with an N-1 contingency at the end of the horizon. An action that cannot be staffed names what is missing.
Restoration · 2DPractice incident · invented
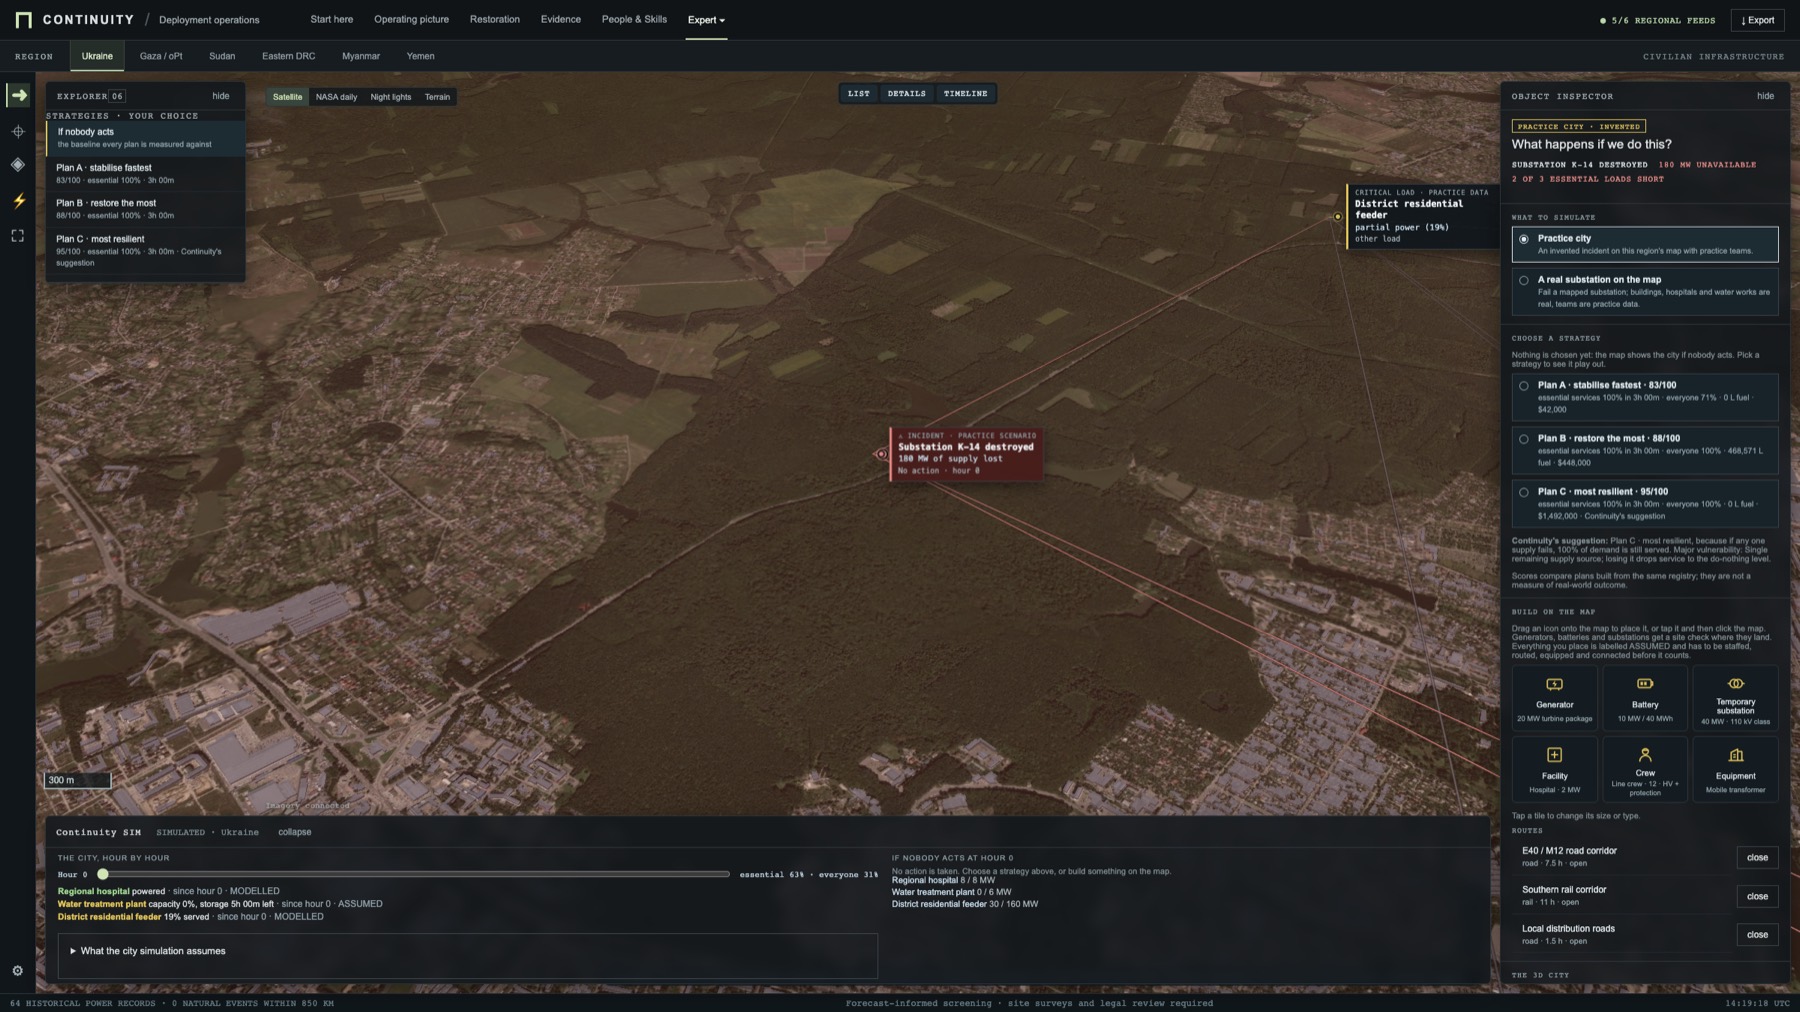
05 — Continuity SIM
Rehearse before committing.
Break a substation, choose a strategy, place generators, batteries, crews and closures on a 3D city. Read the consequences hour by hour. Nothing counts until staffed, routed, equipped and connected.
Continuity SIM · 3DPractice city · invented
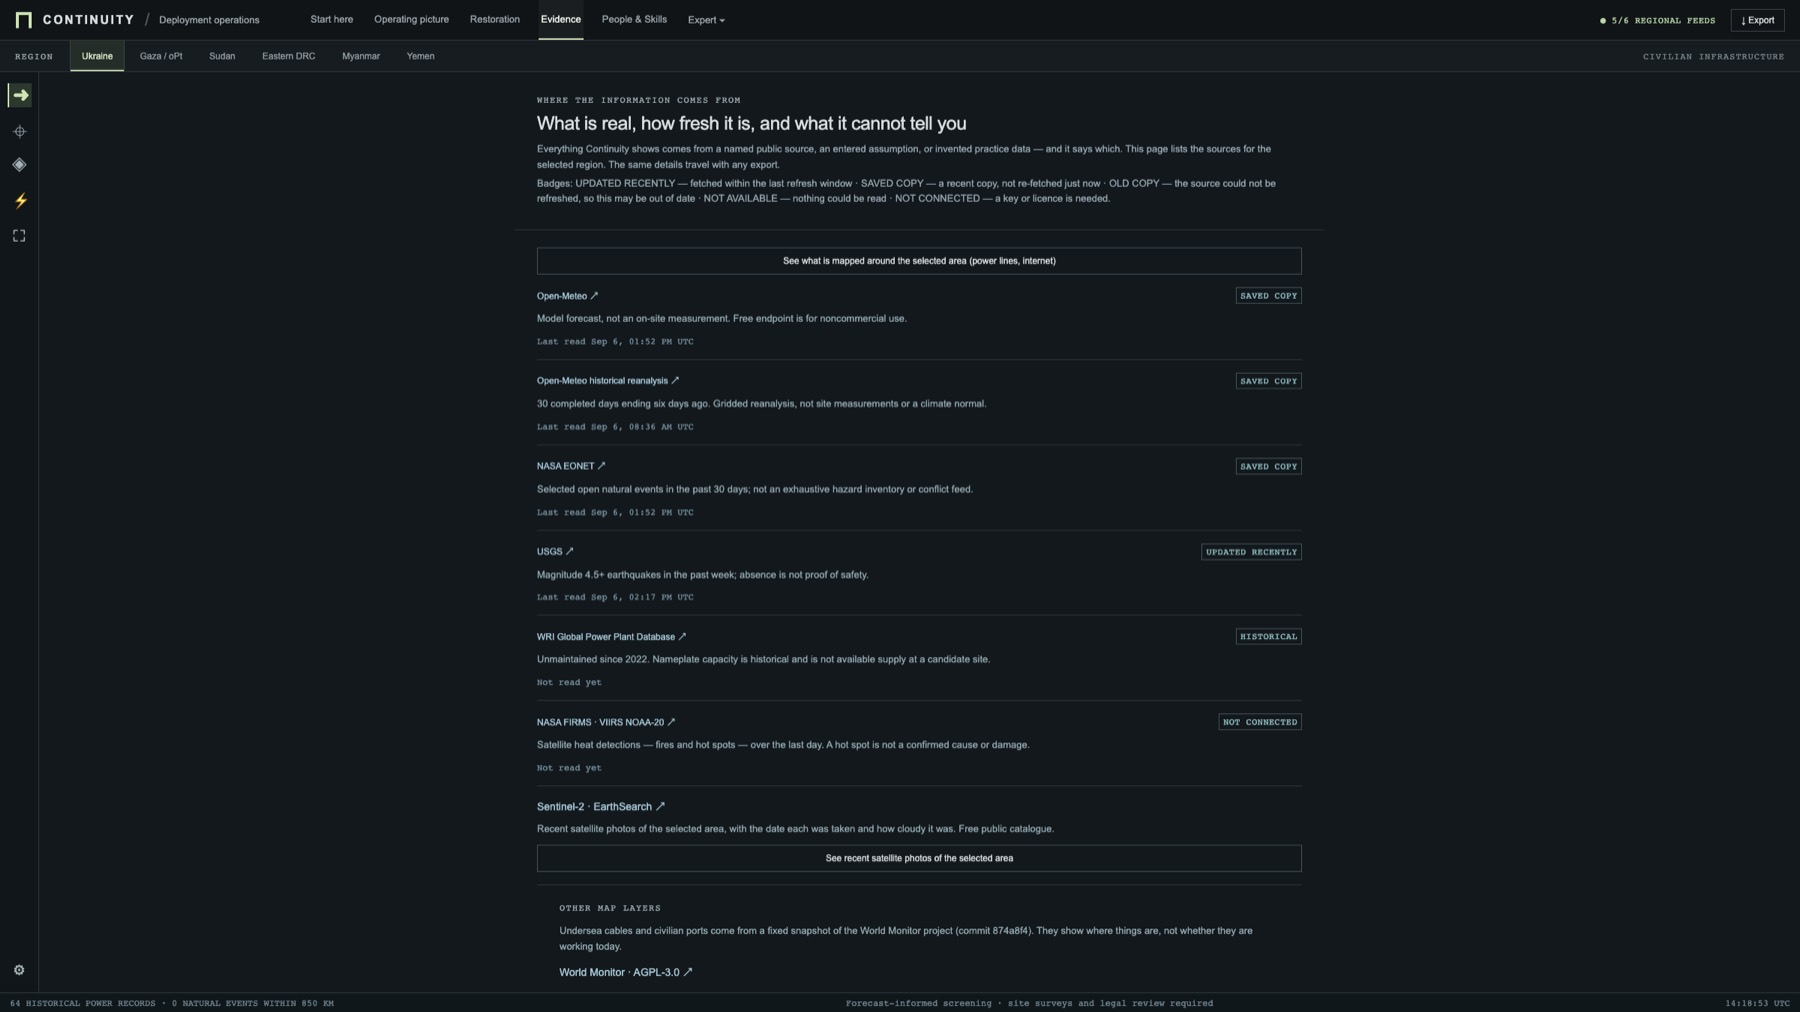
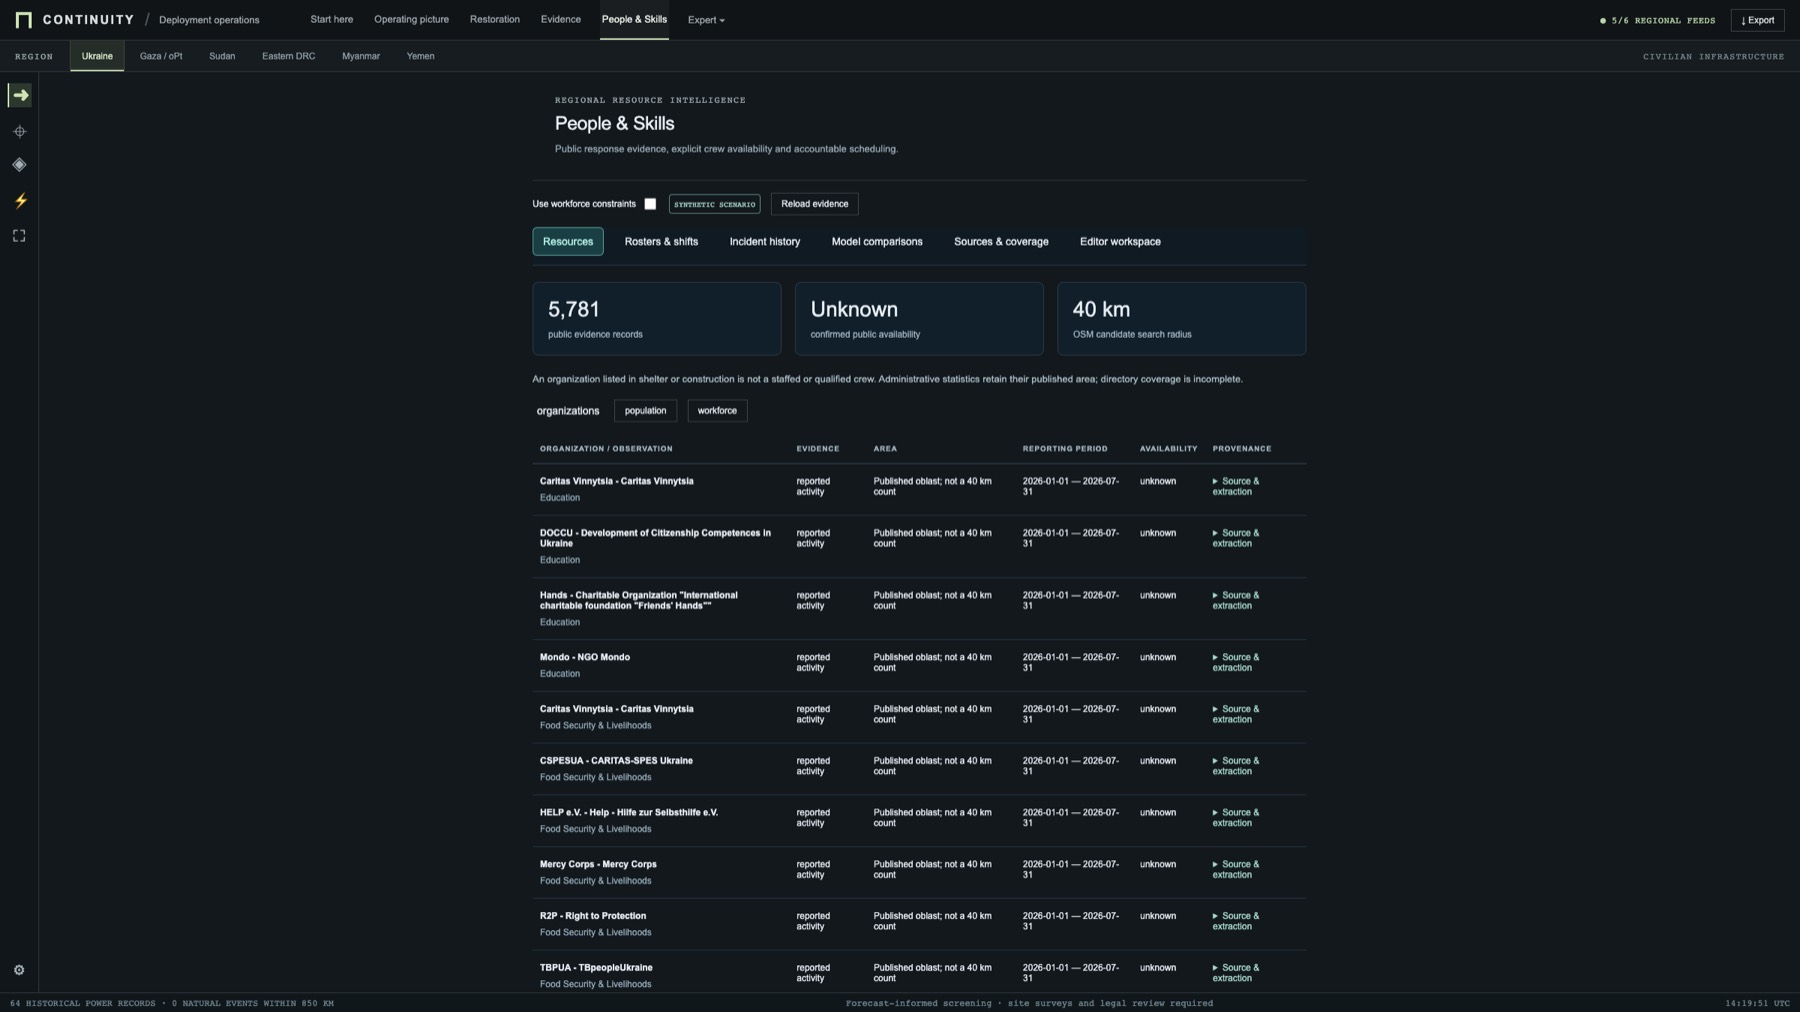
06 — Evidence · Personnel
What is real, how fresh, what it cannot tell you.
Certified personnel, specialised support and volunteers are separate classes, never interchangeable.
EvidenceUkraine
People & SkillsUkraine
07 — Provenance
Eight states. No promotion without a source.
- LIVElive feed, source named
- OBSERVEDfrom the map
- REPORTEDby a named partner
- ASSUMEDplanning default, not measured
- INFERREDestimate, rule stated
- STALEold, last-seen stated
- SIMULATEDpractice data, invented
- UNKNOWNno source recorded
Not established by public data
Spare grid capacity. Plant operation. Fuel stocks. Crew availability. Land permission. Legal eligibility. Assumptions stated, or partner records with declared provenance.
08 — Specifications
Model envelope.
- Evidence radius
- 10 km around a candidate centre
- infrastructure.py
- Substation threshold
- ≥ 35 kV modelled; below, a distribution transformer, counted not modelled
- evidence_graph.py
- Area envelope
- Up to 28 substations and 12 critical facilities per area
- evidence_graph.py
- Line contact
- Line touches substation at ≤ 250 m
- evidence_graph.py
- Node types
site · critical_load · compute_asset · power_asset · substation · communications_provider- dependency_graph.py
- Edge types
powered_by · connected_through · supplied_by · requires_component · backed_up_by- dependency_graph.py
- Provenance
live · observed · reported · assumed · inferred · stale · synthetic · unknown- dependency_graph.py
- Planner
- One mixed-integer programme: crews, equipment, transport corridors, hourly power flow. N-1 contingency at the end of the horizon
- restoration.py
- Evidence sources
- OpenStreetMap via Overpass · Sentinel-2 · VIIRS thermal · Open-Meteo forecast and 30-day reanalysis · PeeringDB · RIPE Atlas · Cloudflare Radar
- live.py · infrastructure.py · satellite.py
- Feed states
fresh · cached · stale · not configured- live.py
- Partner data
- One documented contract; declared provenance kept
- PARTNER-DATA.md
- Hosted function limit
- 120 s
- vercel.json
09 — Planning regions
Six regions. Same rules.
- 01Ukraine
- 02Gaza / oPt
- 03Sudan
- 04Eastern DRC
- 05Myanmar
- 06Yemen
Focus rings are illustrative screening areas, not boundaries.